In the further development of our platform, we are guided by customer feedback: two challenges in IT are capacity planning and operational insight during runtime. Especially in companies that don’t have traditional structures and departments, Quantum helps and supports your team in its tasks — in development and during operations.
Quantum Supports#
In daily operations, overview and insight when debugging applications is often particularly challenging — figuring out why something isn’t working or which part of the application (or stack) isn’t doing what it should, needs to be simple. We took the first step in May of this year (2020) when we introduced a fully automated and scalable centralized logging based on Loki, today we’re going one step further.
Observe#
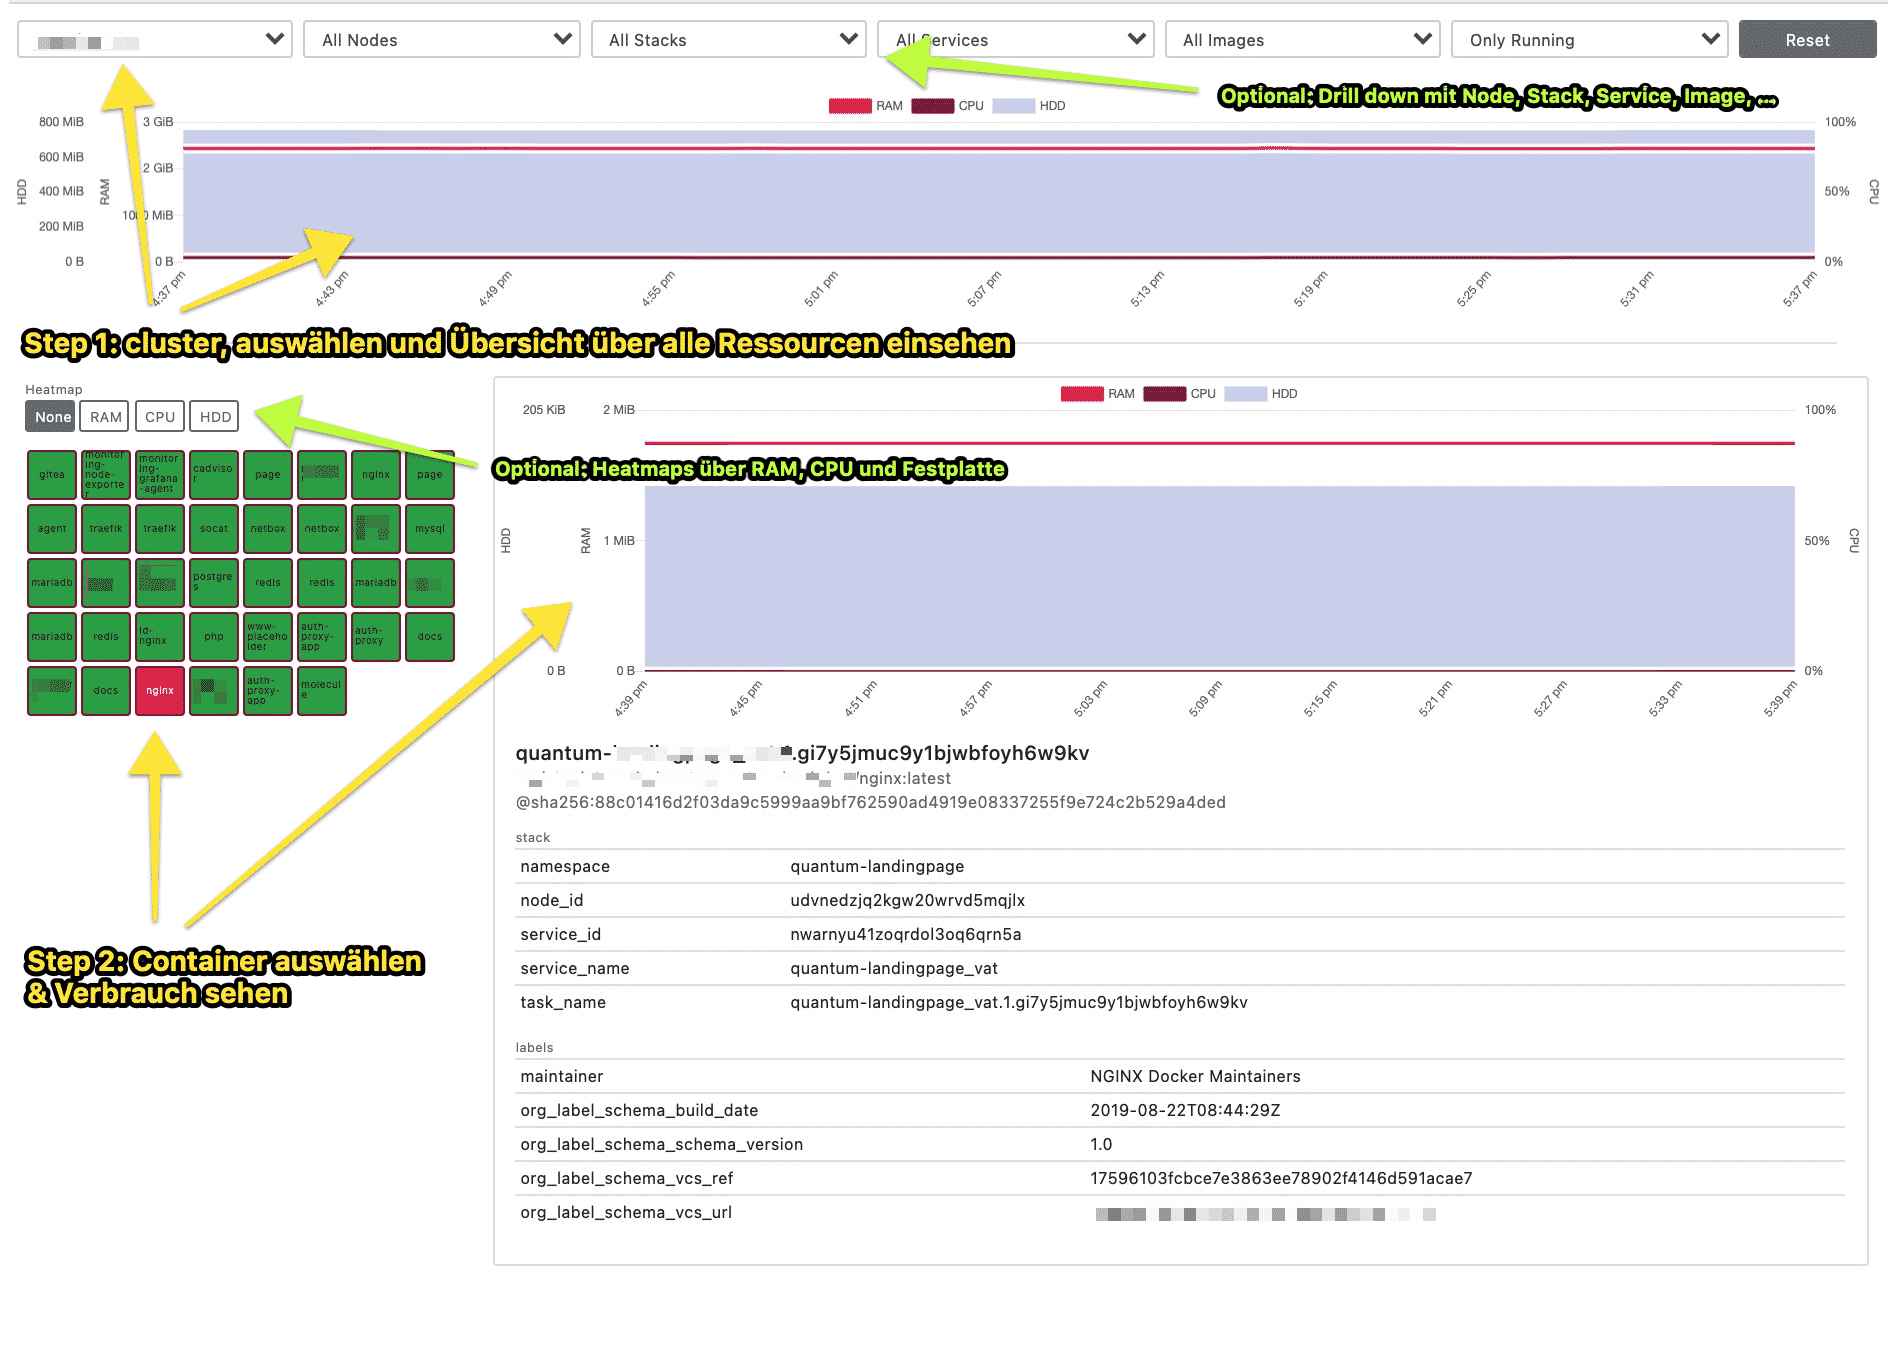
Starting now, we offer our customers a new monitoring solution. Observe was developed by us and provides complete transparency down to the container level with just a few clicks. You select your cluster in the interface and can drill down to inspect stacks, services, or individual containers. Additionally, we offer sorting for the most important parameters — CPU (utilization), RAM, and disk (HDD).
Of course, this is just the beginning and the list of things we want to implement is long. At the same time, we’re curious to see how our customers use it and look forward to active feedback.
Alert#
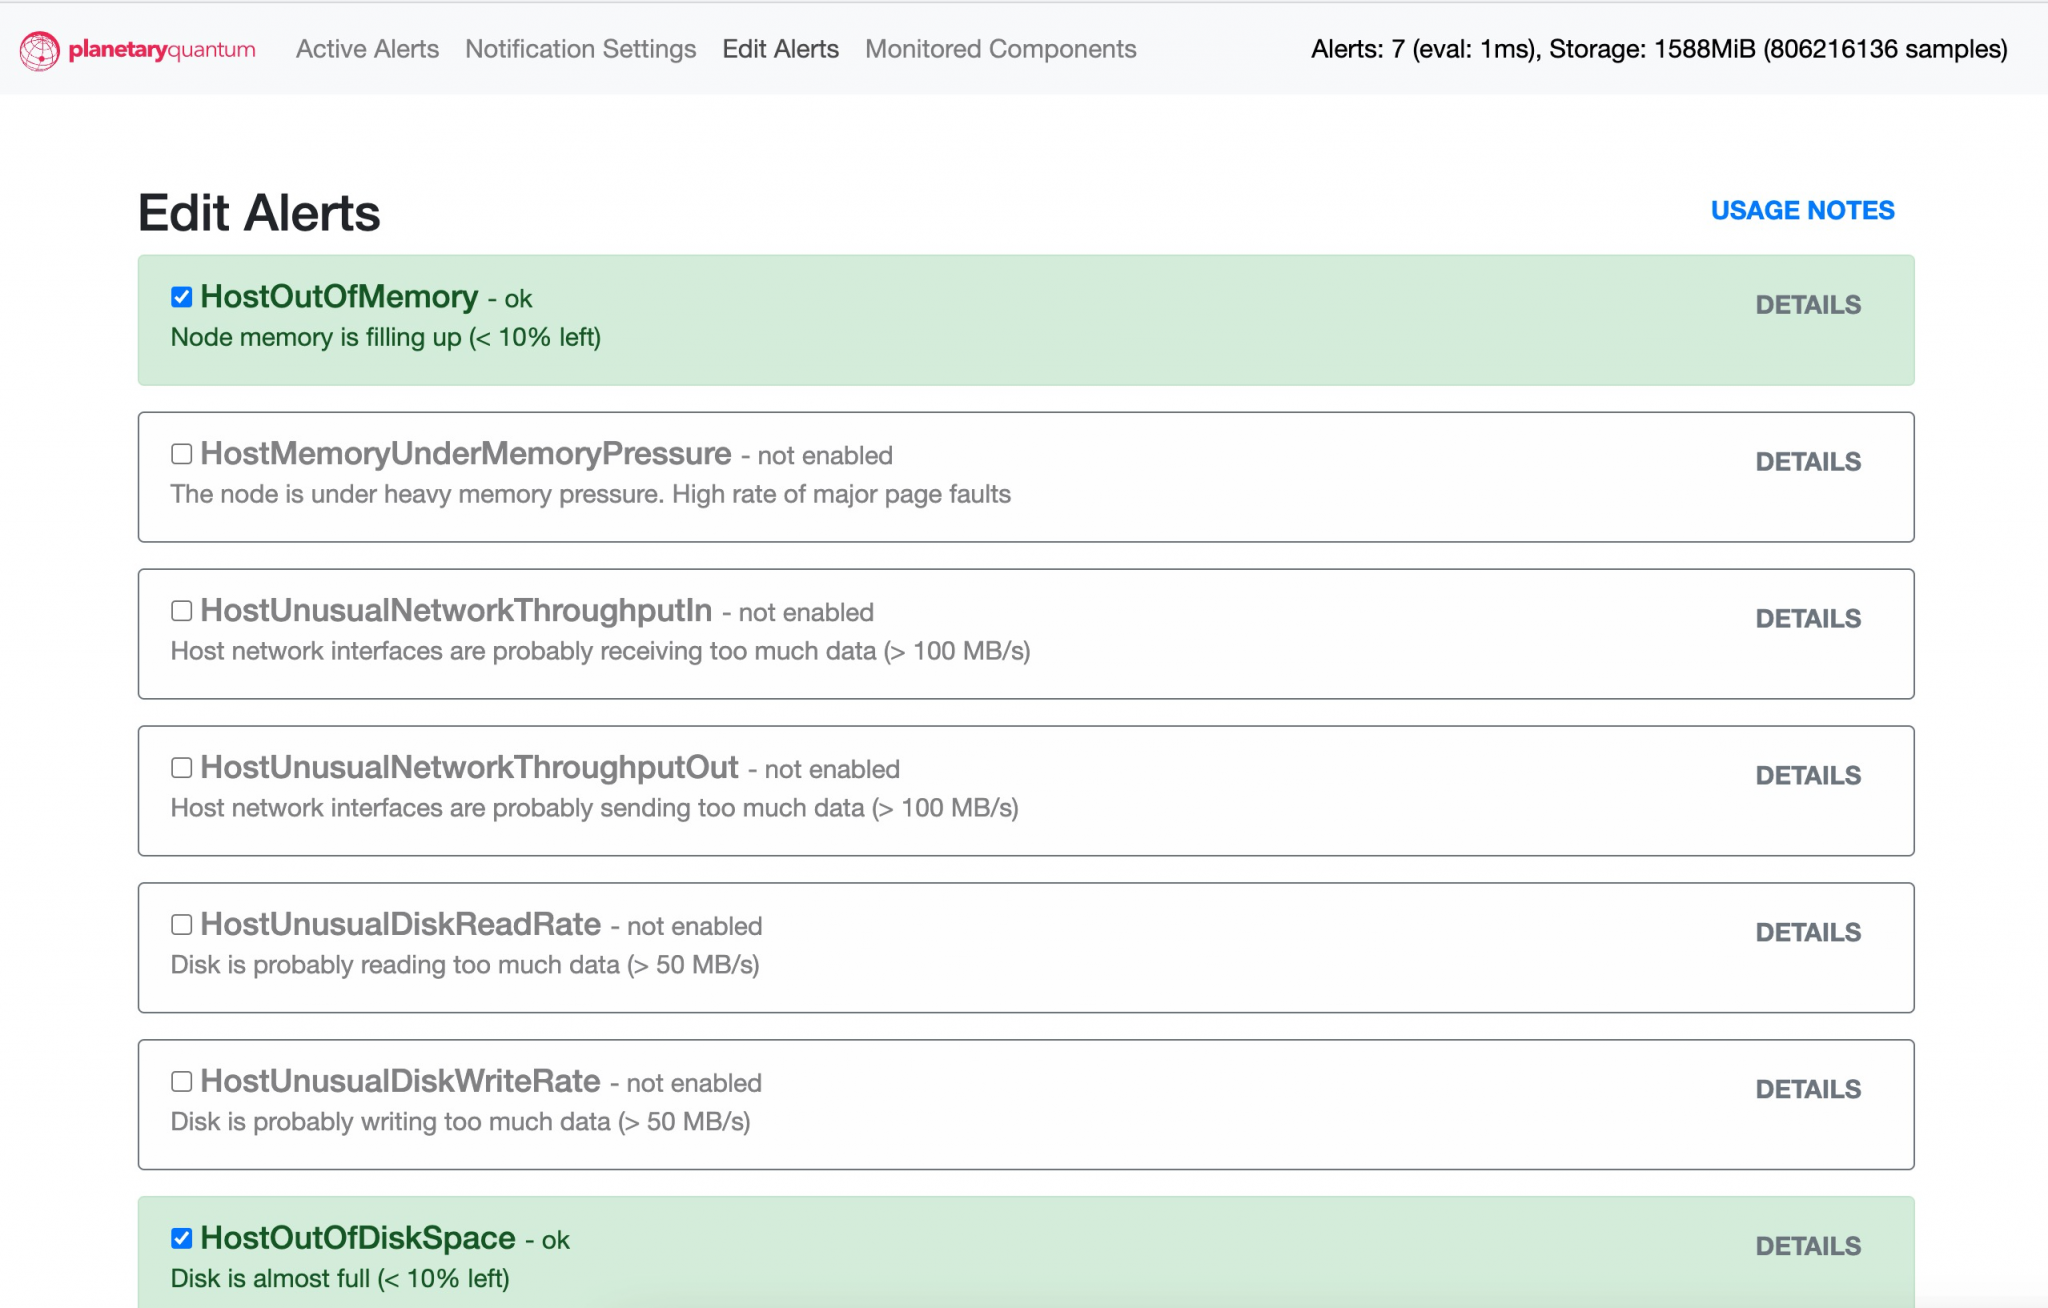
The first step is of course collecting and processing data — the next step is notification. Together with Observe, we also offer our customers the ability to set up notifications themselves. Currently, we support Slack and webhooks as notification mechanisms. Customers have the option to activate a variety of alerts and will then be notified accordingly by our system.
Technology and Pricing#
Behind the scenes, we operate a number of components to collect and process metrics. We deploy a Prometheus-compatible agent on our customers’ systems that collects metrics from the operating system and Docker (as well as containers). The metrics are sent to a Cortex cluster and stored for the customer.
The operation of Cortex and all necessary components (e.g., proxies, caches, databases, and storage) is handled by us. Your data is stored 100% in our GDPR-compliant infrastructure for up to one week.
With the GA of Container Monitoring, it will be possible for our customers to store custom metrics from their applications. The beta or basic variant is already included in the base price. Prices for monitoring additional services or their metrics, as well as for setting up custom notification rules, will be announced with GA.