Cluster Metrics#
Our platform customers book capacity in the form of CPU, RAM, and disk (HDD). Optionally, these are distributed across different nodes to increase horizontal scalability and fault tolerance. Until now, there was no concept in Portainer for collecting and displaying this data – the use of an additional stack for monitoring and evaluating resources was necessary: additional infrastructure and work for our customers. That’s why we’re all the more pleased with this update to simplify the work for our customers.
What’s New?#
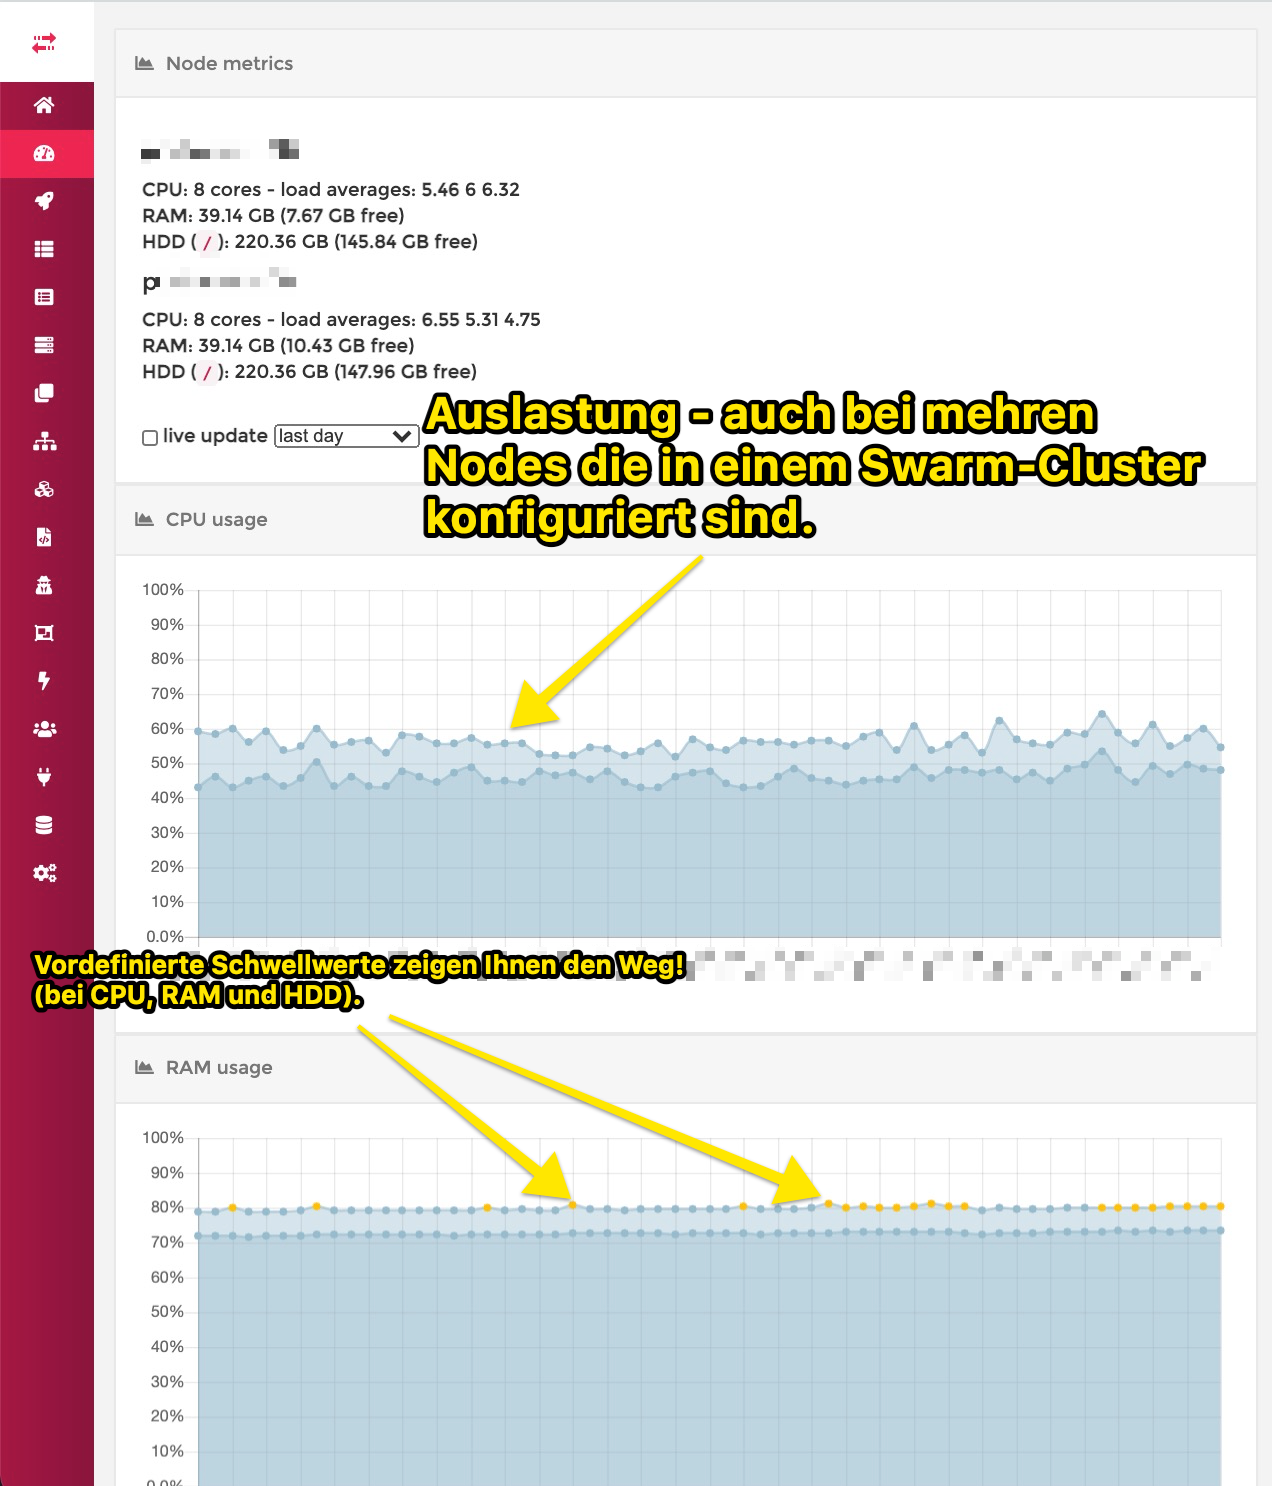
The most important resources are CPU, RAM, and disk. Quantum monitors these 24/7. With this enhancement to Portainer, we offer our customers access to these metrics in the form of simple graphs and notifications that are always conveniently accessible via the dashboard.
The graphs display all nodes running in the cluster individually.
Via a dropdown, you can change the view over the last hour, the last 12 hours, the last 24 hours, or the last 7 days.
The thresholds displayed in the graphs (yellow and red) trigger notifications. This way, the customer always knows the status of their cluster.
As transport mechanisms, we currently support Slack and webhooks. Setup is currently done through our support team.
Example#